matplotlib.figure.Figure.add_gridspec#
- Figure.add_gridspec(nrows=1, ncols=1, **kwargs)[source]#
Low-level API for creating a
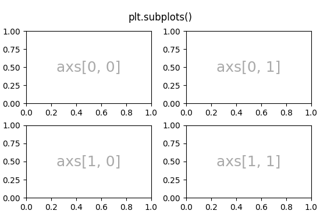
GridSpecthat has this figure as a parent.This is a low-level API, allowing you to create a gridspec and subsequently add subplots based on the gridspec. Most users do not need that freedom and should use the higher-level methods
subplotsorsubplot_mosaic.- Parameters:
- nrowsint, default: 1
Number of rows in grid.
- ncolsint, default: 1
Number of columns in grid.
- Returns:
- Other Parameters:
- **kwargs
Keyword arguments are passed to
GridSpec.
See also
Examples
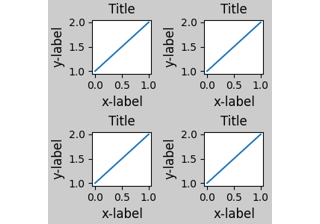
Adding a subplot that spans two rows:
fig = plt.figure()
gs = fig.add_gridspec(2, 2)
ax1 = fig.add_subplot(gs[0, 0])
ax2 = fig.add_subplot(gs[1, 0])
# spans two rows:
ax3 = fig.add_subplot(gs[:, 1])