matplotlib.axes.Axes.tripcolor#
- Axes.tripcolor(*args, alpha=1.0, norm=None, cmap=None, vmin=None, vmax=None, shading='flat', facecolors=None, **kwargs)[source]#
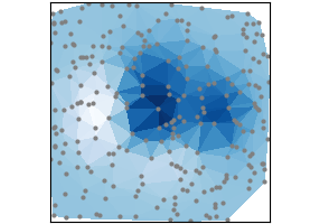
Create a pseudocolor plot of an unstructured triangular grid.
Call signatures:
tripcolor(triangulation, c, *, ...)
tripcolor(x, y, c, *, [triangles=triangles], [mask=mask], ...)
The triangular grid can be specified either by passing a
Triangulationobject as the first parameter, or by passing the points x, y and optionally the triangles and a mask. SeeTriangulationfor an explanation of these parameters.It is possible to pass the triangles positionally, i.e.
tripcolor(x, y, triangles, c, ...). However, this is discouraged. For more clarity, pass triangles via keyword argument.If neither of triangulation or triangles are given, the triangulation is calculated on the fly. In this case, it does not make sense to provide colors at the triangle faces via c or facecolors because there are multiple possible triangulations for a group of points and you don't know which triangles will be constructed.
- Parameters:
- triangulation
Triangulation An already created triangular grid.
- x, y, triangles, mask
Parameters defining the triangular grid. See
Triangulation. This is mutually exclusive with specifying triangulation.- carray-like
The color values, either for the points or for the triangles. Which one is automatically inferred from the length of c, i.e. does it match the number of points or the number of triangles. If there are the same number of points and triangles in the triangulation it is assumed that color values are defined at points; to force the use of color values at triangles use the keyword argument
facecolors=cinstead of justc. This parameter is position-only.- facecolorsarray-like, optional
Can be used alternatively to c to specify colors at the triangle faces. This parameter takes precedence over c.
- shading{'flat', 'gouraud'}, default: 'flat'
If 'flat' and the color values c are defined at points, the color values used for each triangle are from the mean c of the triangle's three points. If shading is 'gouraud' then color values must be defined at points.
- cmapstr or
Colormap, default:rcParams["image.cmap"](default:'viridis') The Colormap instance or registered colormap name used to map scalar data to colors.
- normstr or
Normalize, optional The normalization method used to scale scalar data to the [0, 1] range before mapping to colors using cmap. By default, a linear scaling is used, mapping the lowest value to 0 and the highest to 1.
If given, this can be one of the following:
An instance of
Normalizeor one of its subclasses (see Colormap normalization).A scale name, i.e. one of "linear", "log", "symlog", "logit", etc. For a list of available scales, call
matplotlib.scale.get_scale_names(). In that case, a suitableNormalizesubclass is dynamically generated and instantiated.
- vmin, vmaxfloat, optional
When using scalar data and no explicit norm, vmin and vmax define the data range that the colormap covers. By default, the colormap covers the complete value range of the supplied data. It is an error to use vmin/vmax when a norm instance is given (but using a
strnorm name together with vmin/vmax is acceptable).- colorizer
Colorizeror None, default: None The Colorizer object used to map color to data. If None, a Colorizer object is created from a norm and cmap.
- triangulation
- Returns:
PolyCollectionorTriMeshThe result depends on shading: For
shading='flat'the result is aPolyCollection, forshading='gouraud'the result is aTriMesh.
- Other Parameters:
- **kwargs
Collectionproperties Property
Description
a filter function, which takes a (m, n, 3) float array and a dpi value, and returns a (m, n, 3) array and two offsets from the bottom left corner of the image
array-like or float or None
bool
antialiasedoraaorantialiasedsbool or list of bools
array-like or None
CapStyleor {'butt', 'projecting', 'round'}(vmin: float, vmax: float)
BboxBaseor Nonebool
Patch or (Path, Transform) or None
Colormapor str or Nonecolor or list of RGBA tuples
edgecolororecoredgecolorsfacecolororfacecolorsorfcstr
{'/', '\', '|', '-', '+', 'x', 'o', 'O', '.', '*'}
unknown
bool
JoinStyleor {'miter', 'round', 'bevel'}object
linestyleordashesorlinestylesorlsstr or tuple or list thereof
linewidthorlinewidthsorlwfloat or list of floats
bool
Normalizeor str or None(N, 2) or (2,) array-like
list of
AbstractPathEffectunknown
None or bool or float or callable
float
bool
(scale: float, length: float, randomness: float)
bool or None
str
list of str or None
bool
float
- **kwargs