matplotlib.axes.Axes.vlines#
- Axes.vlines(x, ymin, ymax, colors=None, linestyles='solid', *, label='', data=None, **kwargs)[source]#
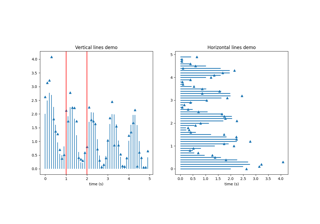
Plot vertical lines at each x from ymin to ymax.
- Parameters:
- xfloat or array-like
x-indexes where to plot the lines.
- ymin, ymaxfloat or array-like
Respective beginning and end of each line. If scalars are provided, all lines will have the same length.
- colorscolor or list of color, default:
rcParams["lines.color"](default:'C0') - linestyles{'solid', 'dashed', 'dashdot', 'dotted'}, default: 'solid'
- labelstr, default: ''
- Returns:
- Other Parameters:
- dataindexable object, optional
If given, the following parameters also accept a string
s, which is interpreted asdata[s]ifsis a key indata:x, ymin, ymax, colors
- **kwargs
LineCollectionproperties.