matplotlib.axis.Axis.set_major_locator#
- Axis.set_major_locator(locator)[source]#
Set the locator of the major ticker.
- Parameters:
- locator
Locator
- locator
Examples using matplotlib.axis.Axis.set_major_locator#
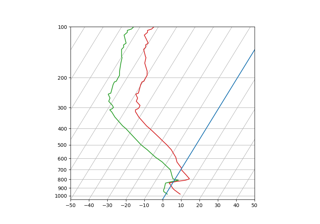
SkewT-logP diagram: using transforms and custom projections
SkewT-logP diagram: using transforms and custom projections