mpl_toolkits.mplot3d.axes3d.Axes3D.scatter#
- Axes3D.scatter(xs, ys, zs=0, zdir='z', s=20, c=None, depthshade=True, *args, axlim_clip=False, data=None, **kwargs)[source]#
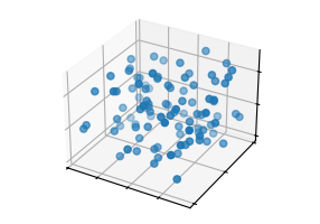
Create a scatter plot.
- Parameters:
- xs, ysarray-like
The data positions.
- zsfloat or array-like, default: 0
The z-positions. Either an array of the same length as xs and ys or a single value to place all points in the same plane.
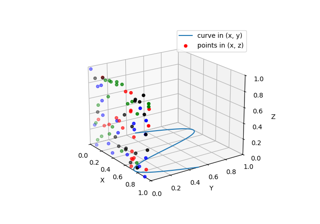
- zdir{'x', 'y', 'z', '-x', '-y', '-z'}, default: 'z'
The axis direction for the zs. This is useful when plotting 2D data on a 3D Axes. The data must be passed as xs, ys. Setting zdir to 'y' then plots the data to the x-z-plane.
See also Plot 2D data on 3D plot.
- sfloat or array-like, default: 20
The marker size in points**2. Either an array of the same length as xs and ys or a single value to make all markers the same size.
- ccolor, sequence, or sequence of colors, optional
The marker color. Possible values:
A single color format string.
A sequence of colors of length n.
A sequence of n numbers to be mapped to colors using cmap and norm.
A 2D array in which the rows are RGB or RGBA.
For more details see the c argument of
scatter.- depthshadebool, default: True
Whether to shade the scatter markers to give the appearance of depth. Each call to
scatter()will perform its depthshading independently.- axlim_clipbool, default: False
Whether to hide the scatter points outside the axes view limits.
Added in version 3.10.
- dataindexable object, optional
If given, the following parameters also accept a string
s, which is interpreted asdata[s]ifsis a key indata:xs, ys, zs, s, edgecolors, c, facecolor, facecolors, color
- **kwargs
All other keyword arguments are passed on to
scatter.
- Returns:
- paths
PathCollection
- paths