mpl_toolkits.mplot3d.axes3d.Axes3D.contour#
- Axes3D.contour(X, Y, Z, *args, extend3d=False, stride=5, zdir='z', offset=None, axlim_clip=False, data=None, **kwargs)[source]#
Create a 3D contour plot.
- Parameters:
- X, Y, Zarray-like,
Input data. See
Axes.contourfor supported data shapes.- extend3dbool, default: False
Whether to extend contour in 3D.
- strideint, default: 5
Step size for extending contour.
- zdir{'x', 'y', 'z'}, default: 'z'
The direction to use.
- offsetfloat, optional
If specified, plot a projection of the contour lines at this position in a plane normal to zdir.
- axlim_clipbool, default: False
Whether to hide lines with a vertex outside the axes view limits.
Added in version 3.10.
- dataindexable object, optional
If given, all parameters also accept a string
s, which is interpreted asdata[s]ifsis a key indata.- *args, **kwargs
Other arguments are forwarded to
matplotlib.axes.Axes.contour.
- Returns:
- matplotlib.contour.QuadContourSet
Examples using mpl_toolkits.mplot3d.axes3d.Axes3D.contour#
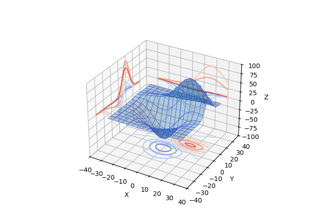
Plot contour (level) curves in 3D using the extend3d option
Plot contour (level) curves in 3D using the extend3d option