mpl_toolkits.mplot3d.axes3d.Axes3D.plot#
- Axes3D.plot(xs, ys, *args, zdir='z', axlim_clip=False, **kwargs)[source]#
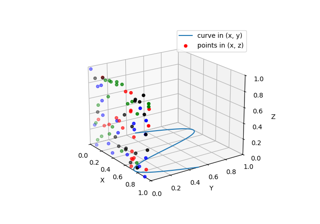
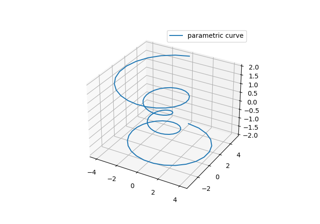
Plot 2D or 3D data.
- Parameters:
- xs1D array-like
x coordinates of vertices.
- ys1D array-like
y coordinates of vertices.
- zsfloat or 1D array-like
z coordinates of vertices; either one for all points or one for each point.
- zdir{'x', 'y', 'z'}, default: 'z'
When plotting 2D data, the direction to use as z.
- axlim_clipbool, default: False
Whether to hide data that is outside the axes view limits.
Added in version 3.10.
- **kwargs
Other arguments are forwarded to
matplotlib.axes.Axes.plot.